Needletail — Data integration
A redesign of pSolv’s analytics process automation platform, making complex data workflows easier to create, monitor and understand.
UX research · UX design
Data integration
Web Excellence Award · 2022

Reported increase in platform engagement
Reported reduction in pipeline creation and publishing time
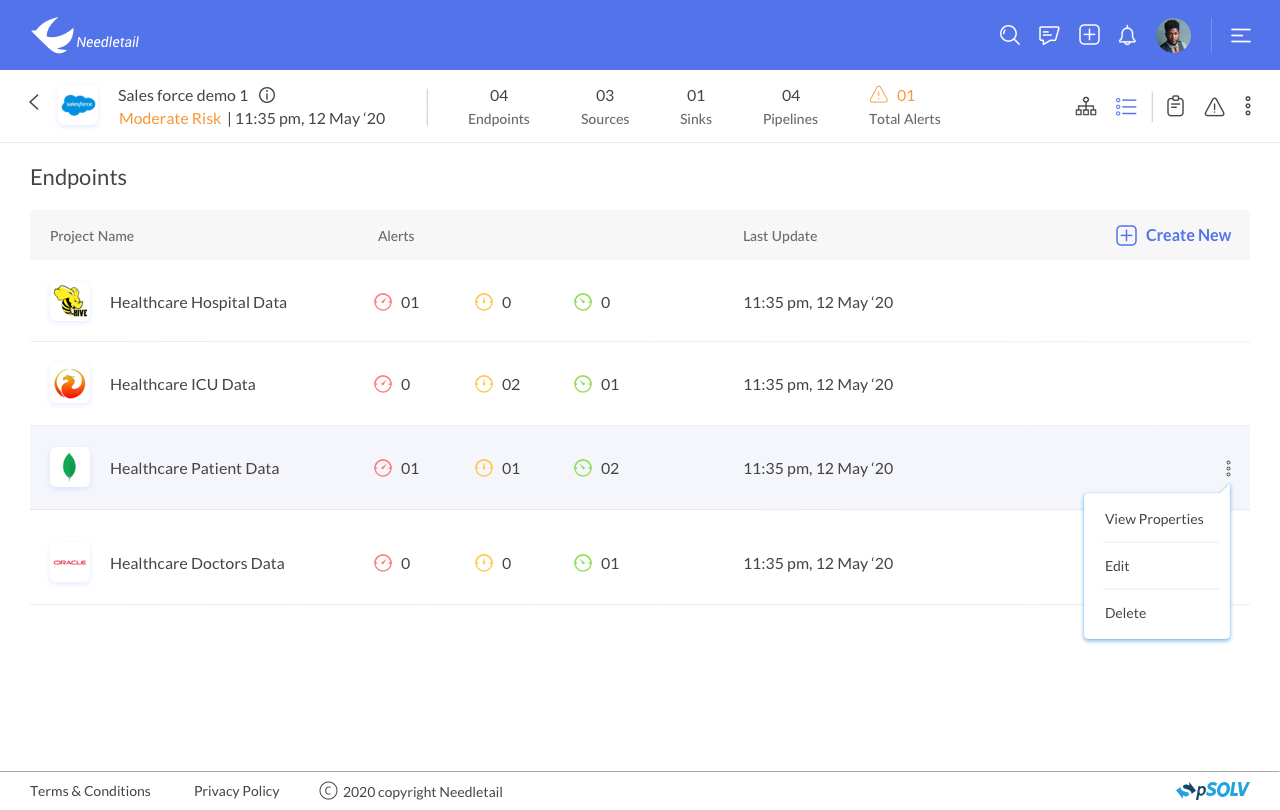
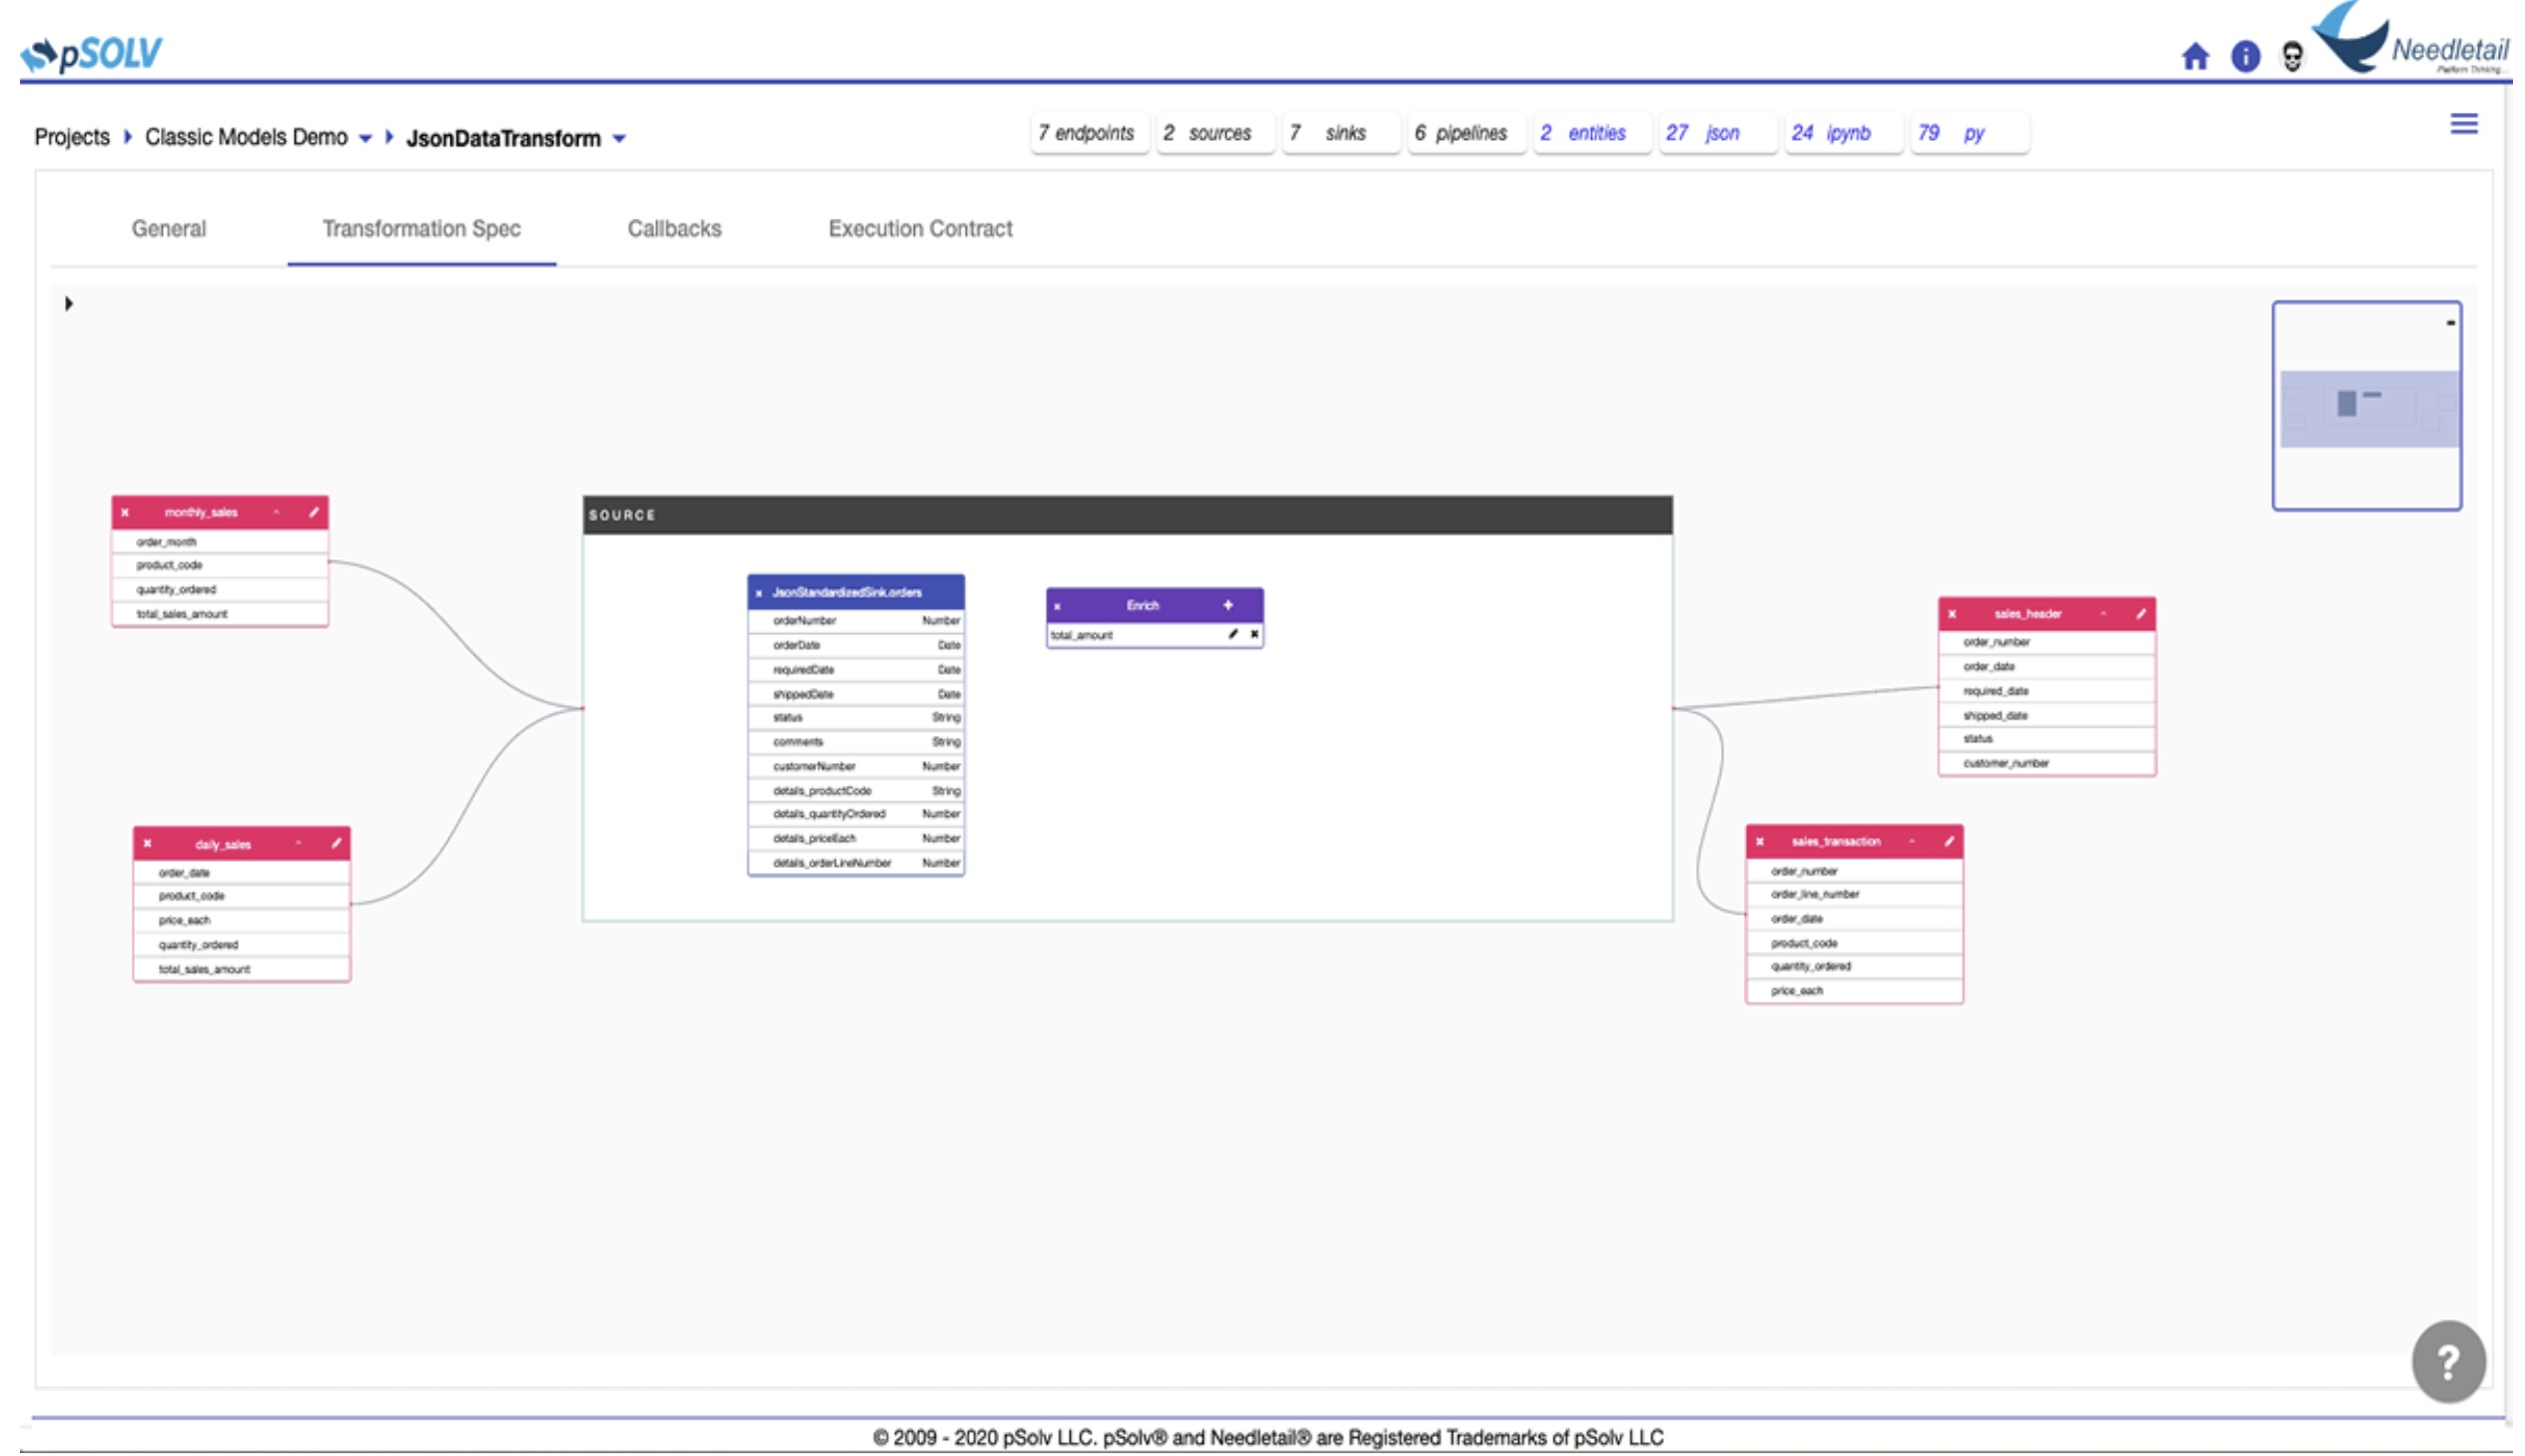
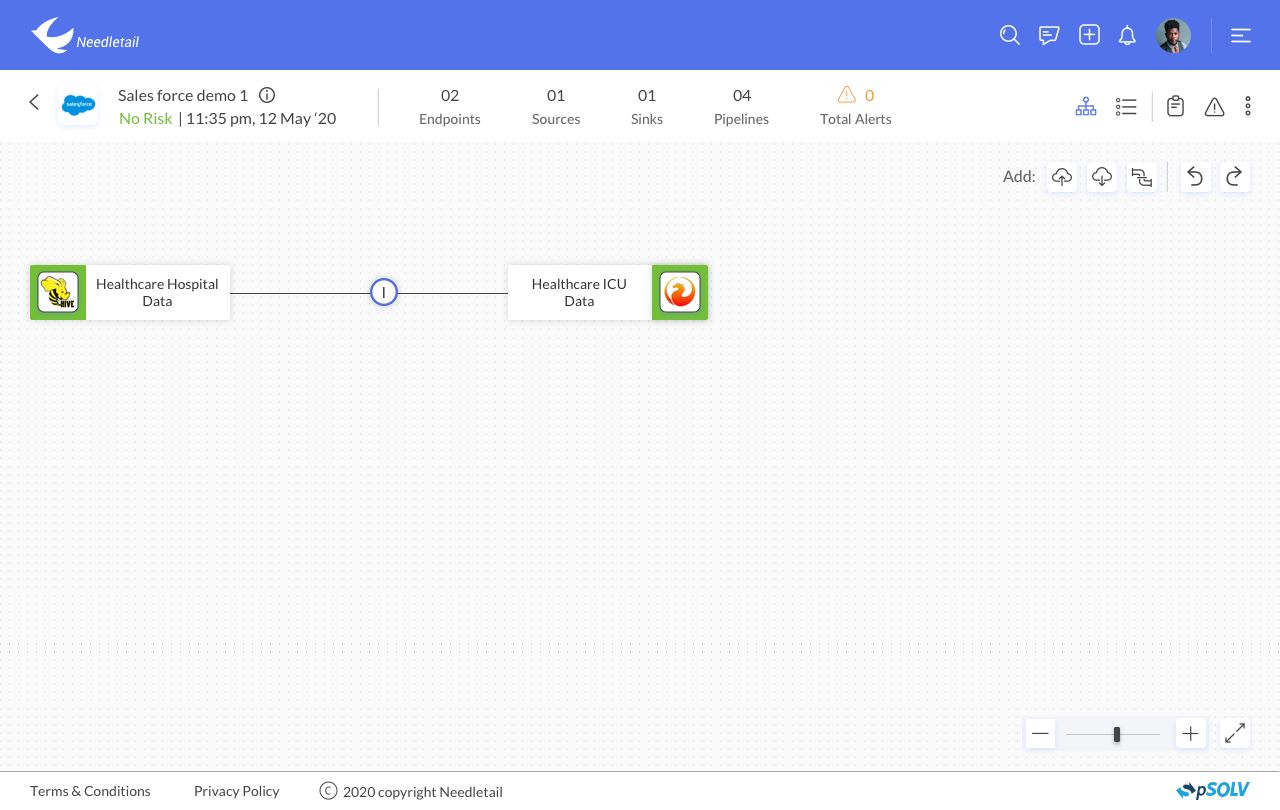
Original and redesigned interfaces compared
The product.
The people.
Needletail helps teams bring data from different sources into a shared, consumption-ready hub. It supports pipeline creation and monitoring alongside data profiling, validation, cleansing and cataloguing.
One platform. Two very different user groups.
The platform served both technical and business users, but its many capabilities were difficult to navigate. Users had to move between separate modules, and the available data was hard to scan and turn into clear next steps.
Make complex data workflows easier to follow.
I used user research to understand different roles, their tasks and the product’s future direction. The redesign focused on clarifying the information hierarchy, mapping user goals to business goals and reducing the steps needed to complete common workflows.
Unified module navigation
At-a-glance project and pipeline health
Visual low-code / no-code pipeline canvas
Guidance and feedback at key steps
The redesign, decision by decision.
A unified navigation pattern keeps modules within reach. Project details surface pipeline health and relevant actions together, while the visual Designer Canvas lets users build and understand data pipelines in one place. Clear feedback and prompts help users move through complex tasks.
Rich UI with Illustration
Designed a modern and clean design aesthetic that is visually appealing and user-friendly. It involves clean layouts, white space, illustrations and consistent use of colour and typography.
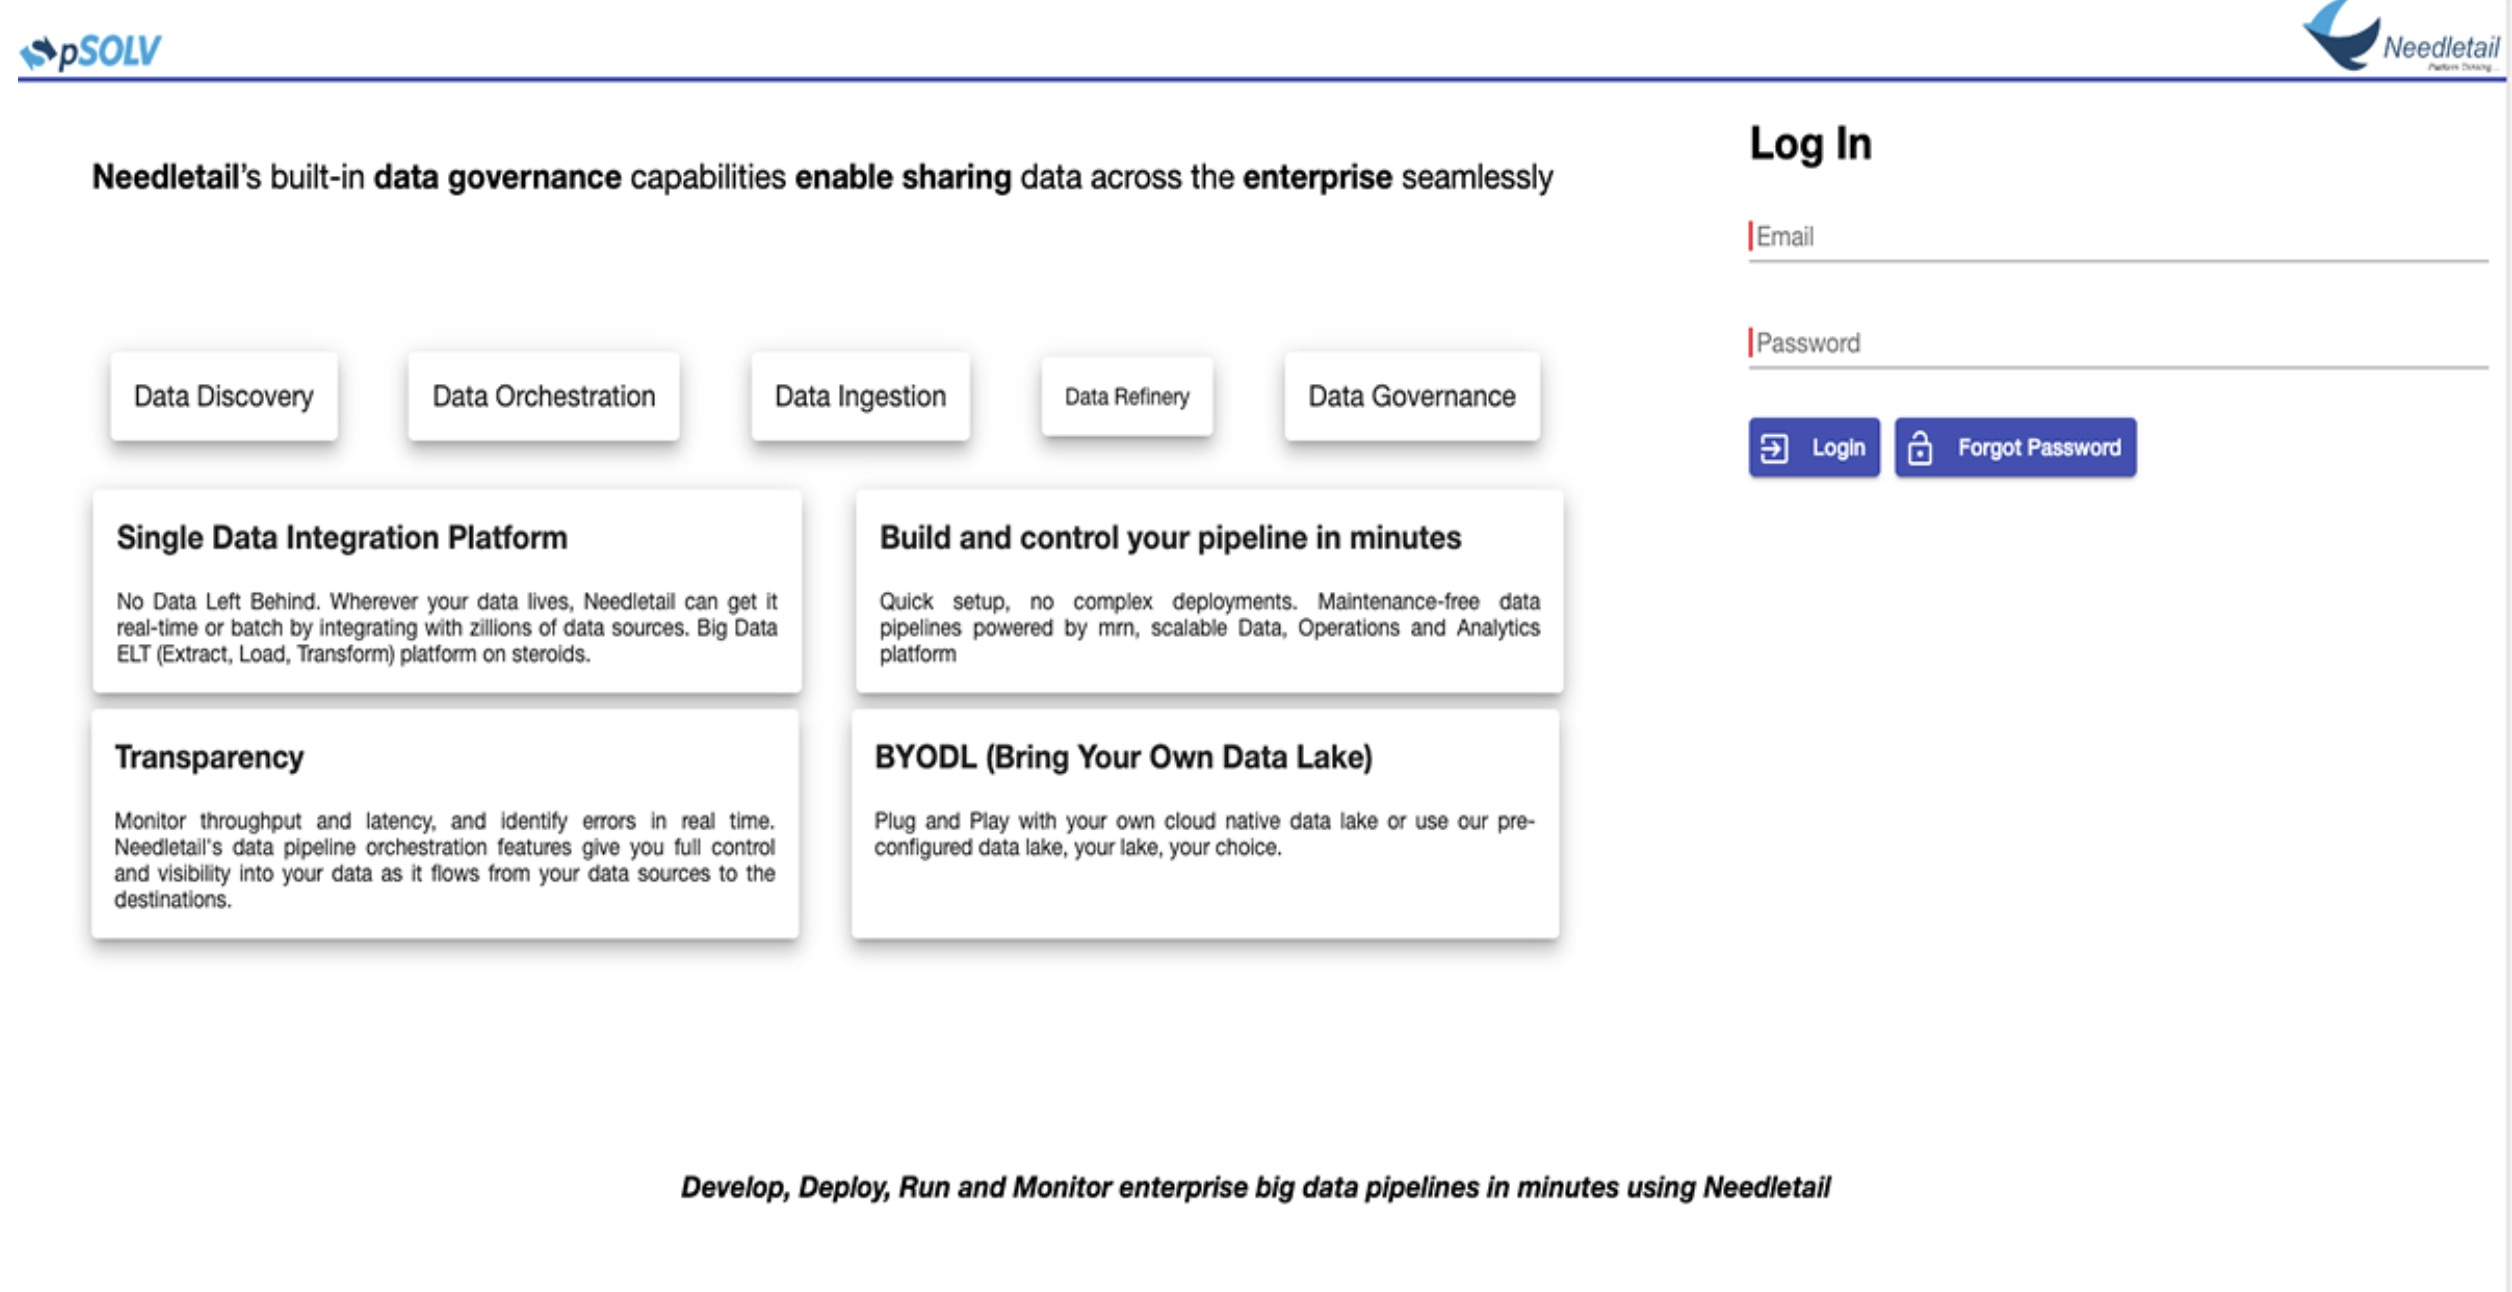
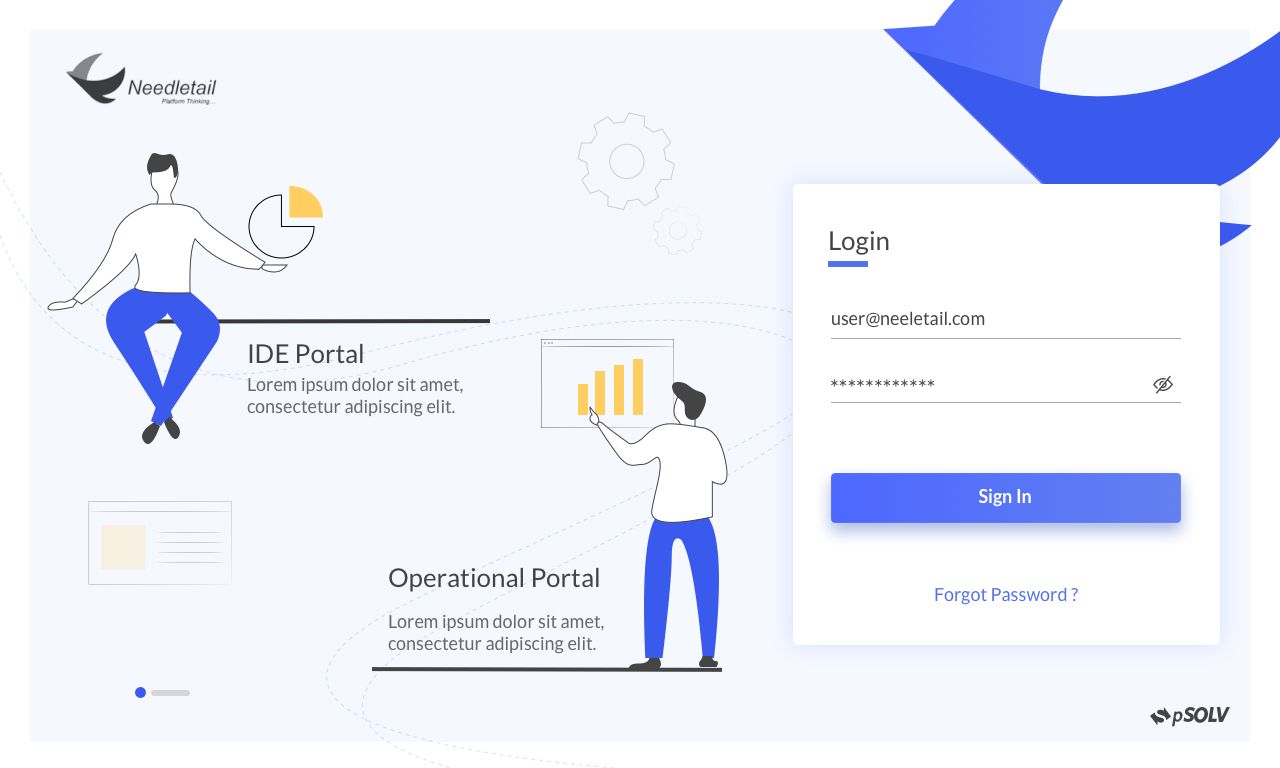
Easy Navigation across Modules with Hamburger Menu
In the old application the modules were considered as Silos and navigating to any other module would force user to leave the context of his current session. In my design I equipped the platform with a simple Hamburger menu that caters to all functionality and modules for Needletail.
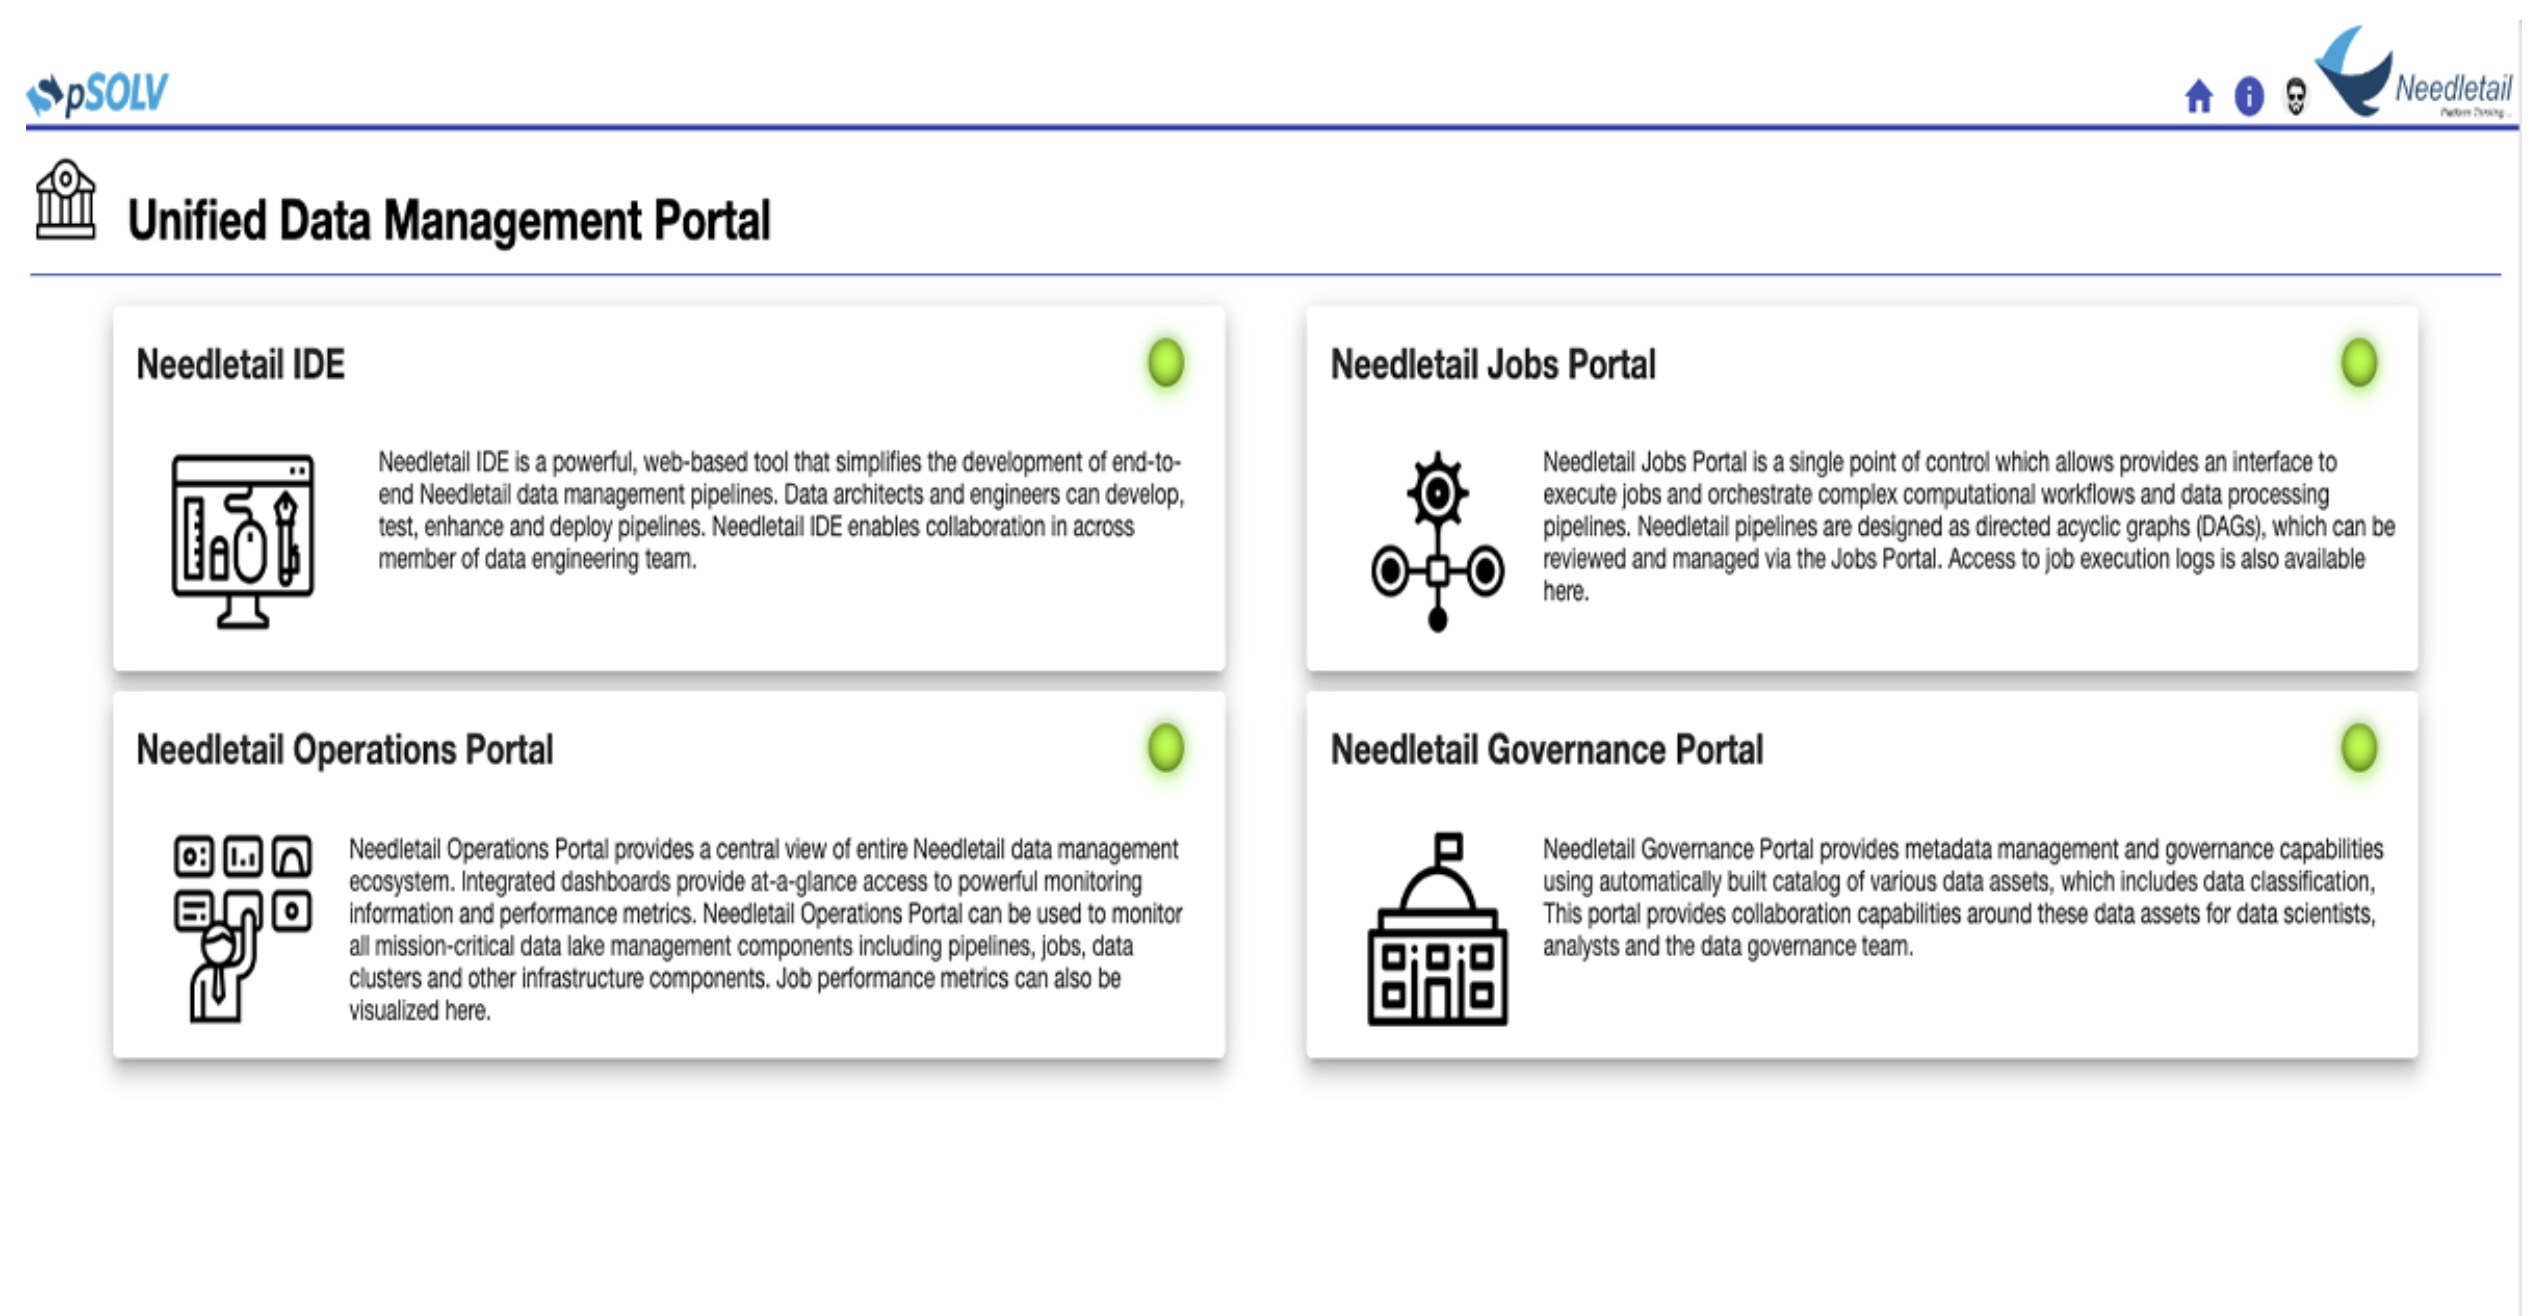
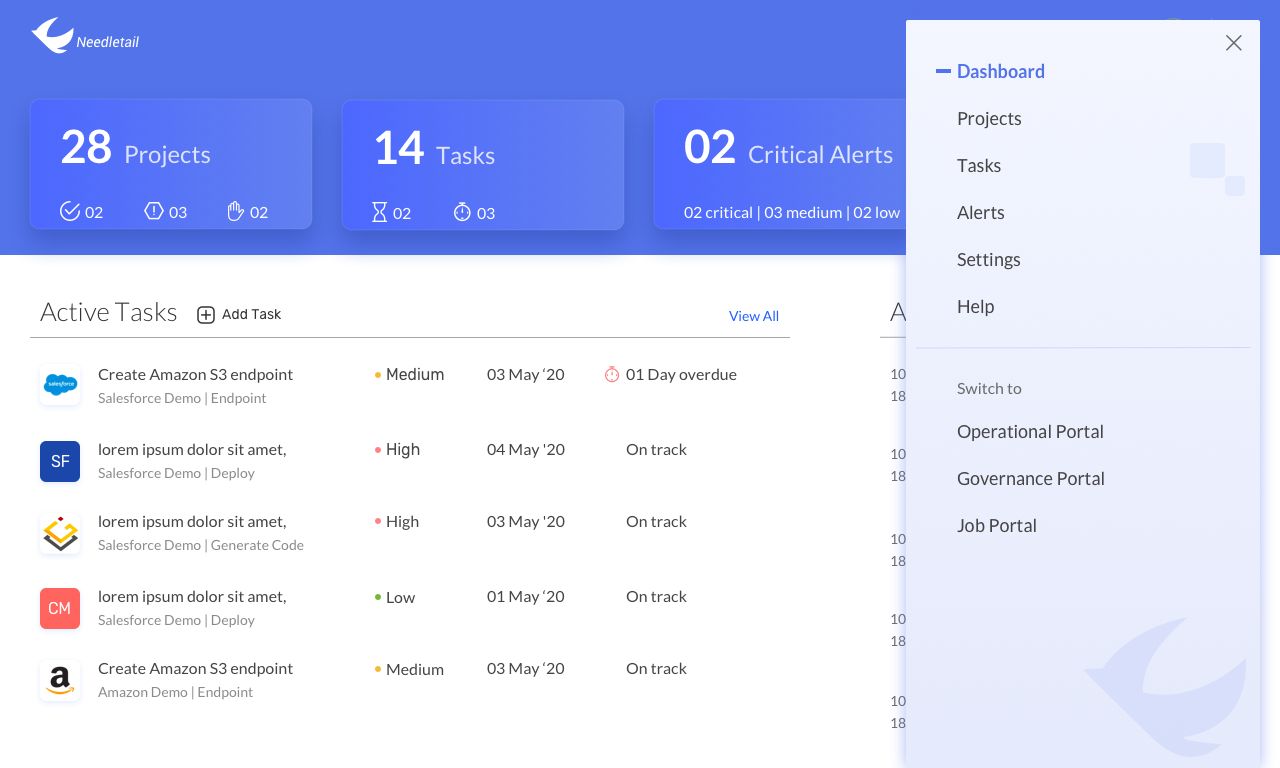
A comprehensive view of project details
Pipeline health and relevant actions come together in one project view. Previously, users navigated to several places to gather the same information.
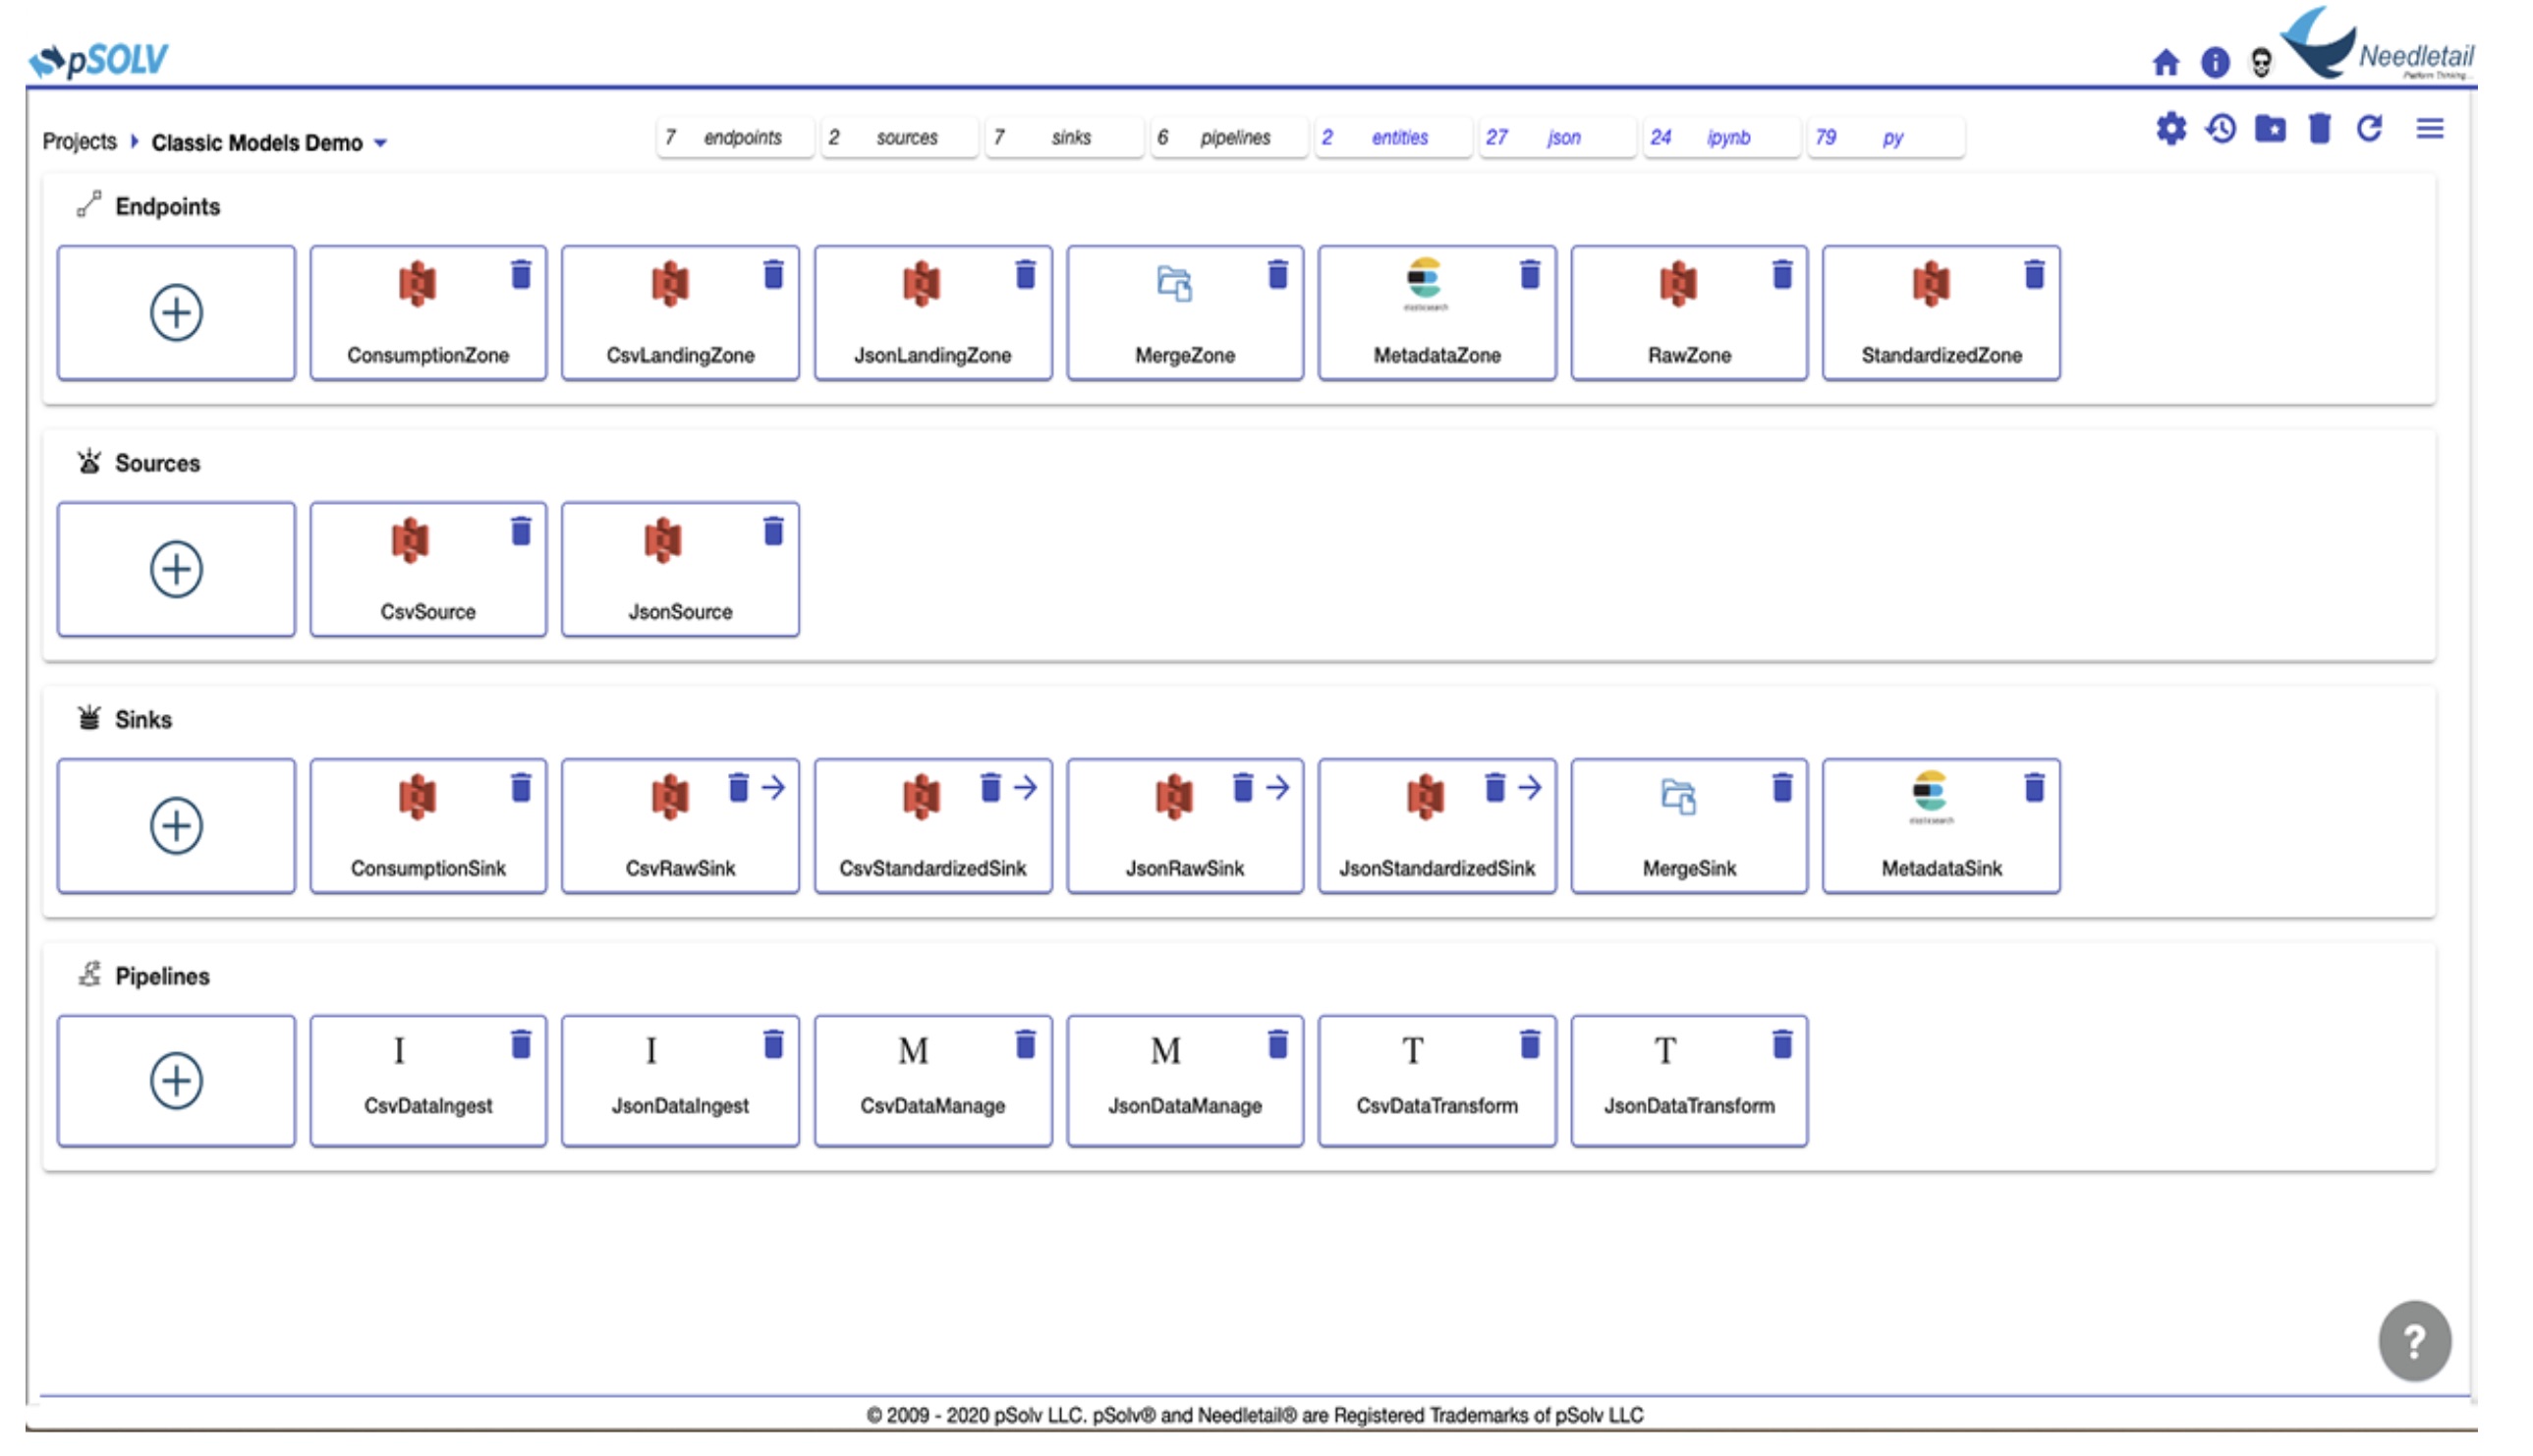
Designer canvas - A truly low code, no code solution
Designer Canvas empowers users to visually create and configure data analysis pipelines directly within the platform. This feature aims to simplify and expedite the pipeline development process, catering to users of varying technical expertise. The visual representation of the pipeline potentially enhances communication and understanding between technical and non-technical stakeholders.
Designed to make
progress visible.
The case study reports a 40% increase in platform engagement and a 65% reduction in the average time to create and publish pipelines. A consistent visual system also brought a clearer experience across the product.